

Post by mhbruin on Jun 28, 2020 16:32:28 GMT -8
How wrong could the polls be?
How likely is a 6 or 7 percentage-point swing to Trump?
Election-forecasting models rely on our ability to put the current political environment in the context of the past. By definition, the underlying statistical models only work if the data we’re using to measure those environments are similarly predictive over time. If the connection between the economy and election outcomes breaks down, for example, the models will fail.
The hope is that polls this time will fit into that historical context. Forecasting models work by simulating a reasonable amount of error (“reasonable” based on the historical distribution of error in the polls) around the average of public polling. If something happens to the polls or the electoral environment to cause them to not be predictive of peoples’ preferences—say, a pandemic that causes a 2-3 percentage point dip for the incumbent president, or polls that overestimate the share of Republicans or Democrats in the electorate—then using that historical distribution error might be misguided.
But we can still rely on that historical distribution to ask the question of how likely a large polling error is to occur. Right now, with Joe Biden up about 9 points in a simple average of the polls, Trump would need a roughly 6-7 point swing in his favor (accounting for a 2-3 bias toward Republicans in the electoral college) to win the election. That swing is a product of two types of error in how well polls now predict election-day results: (a) error from potential movement in the national political environment and (b) error from the potential failure of polls to anticipate the demographic and political composition of voters.
So, how likely is a 6-7 point error in today’s polling average? We can derive that likelihood from the historical distribution of error in polling averages calculated four months out from election days between 1980 and 2016. That distribution takes the shape of normal distributio n centered at 0, with a standard deviation of the root-mean-square error of the past polling averages. That root-mean-square error looks like this:
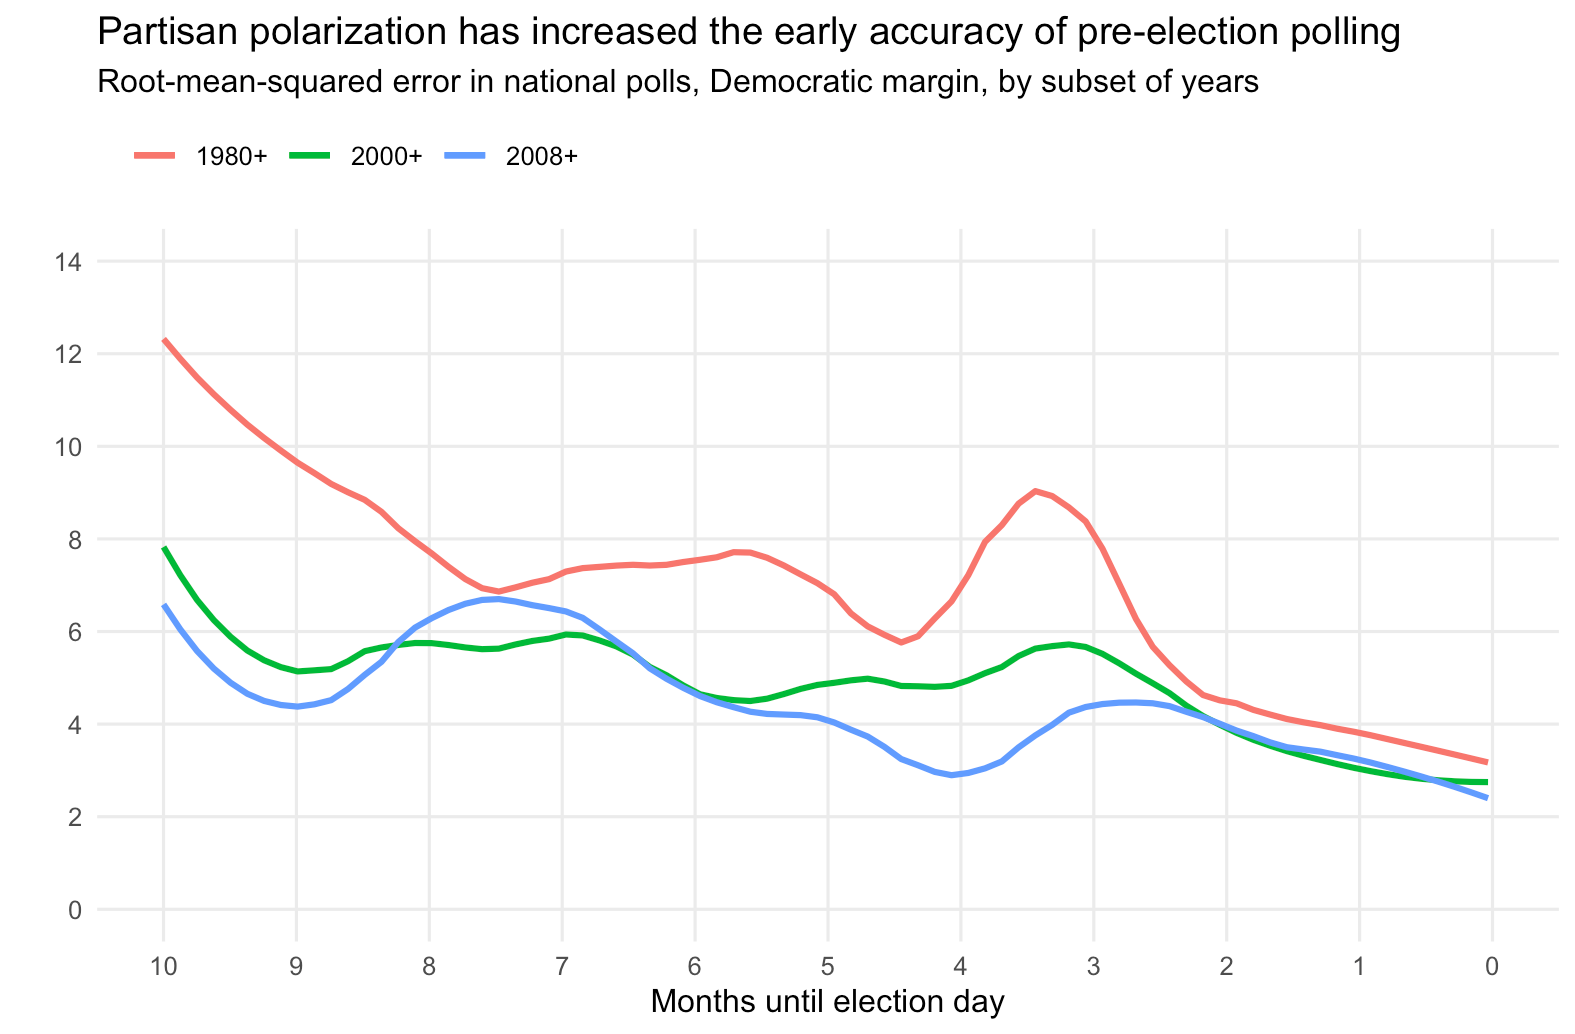
The lines above show the estimated root-mean-square error in the polling averages for three sets of election cycles: each since 1980, 2000, and 2008. One thing you can immediately notice is that polls today are about 1.5-2x as accurate as they were if you include the misses in the 80s and 90s, too.
From here it’s a simple task of statistics and calculating the area under a curve. At 130 days before the election…
• The chance that a candidate who is 9 percentage points ahead in national polls would end up with a vote margin below 3 points is 15%, conditional on the distribution of polling error since 1980
• The chance that a candidate who is 9 percentage points ahead in national polls would end up with a vote margin below 3 points is 10%, conditional on the distribution of polling error since 2000
• The chance that a candidate who is 9 percentage points ahead in national polls would end up with a vote margin below 3 points is 3%, conditional on the distribution of polling error since 2008
Today, according to the full-range of polling errors in the dataset, we give the polling average a margin of error of 11 percentage points. One other way to look at the current election is: what would the root-mean-squared polling error have to be to give Trump a reasonable (>25%?) chance of winning the election? According to this math, about 9 percentage points—or 1.5x the amount of error in polling averages since 1980 and 3x the expected polling error since 2008.
This all to say that it’s pretty unlikely Trump will win. He would have to pull off an upset an order of magnitude better than his 2016 victory to be re-elected, according to the historical reliability of political polls. I don’t think such a swing is likely (by definition of the margin of error defined above) but I’m willing to hear data-driven arguments about why polls will misfire again this year.
How likely is a 6 or 7 percentage-point swing to Trump?
Election-forecasting models rely on our ability to put the current political environment in the context of the past. By definition, the underlying statistical models only work if the data we’re using to measure those environments are similarly predictive over time. If the connection between the economy and election outcomes breaks down, for example, the models will fail.
The hope is that polls this time will fit into that historical context. Forecasting models work by simulating a reasonable amount of error (“reasonable” based on the historical distribution of error in the polls) around the average of public polling. If something happens to the polls or the electoral environment to cause them to not be predictive of peoples’ preferences—say, a pandemic that causes a 2-3 percentage point dip for the incumbent president, or polls that overestimate the share of Republicans or Democrats in the electorate—then using that historical distribution error might be misguided.
But we can still rely on that historical distribution to ask the question of how likely a large polling error is to occur. Right now, with Joe Biden up about 9 points in a simple average of the polls, Trump would need a roughly 6-7 point swing in his favor (accounting for a 2-3 bias toward Republicans in the electoral college) to win the election. That swing is a product of two types of error in how well polls now predict election-day results: (a) error from potential movement in the national political environment and (b) error from the potential failure of polls to anticipate the demographic and political composition of voters.
So, how likely is a 6-7 point error in today’s polling average? We can derive that likelihood from the historical distribution of error in polling averages calculated four months out from election days between 1980 and 2016. That distribution takes the shape of normal distributio n centered at 0, with a standard deviation of the root-mean-square error of the past polling averages. That root-mean-square error looks like this:
The lines above show the estimated root-mean-square error in the polling averages for three sets of election cycles: each since 1980, 2000, and 2008. One thing you can immediately notice is that polls today are about 1.5-2x as accurate as they were if you include the misses in the 80s and 90s, too.
From here it’s a simple task of statistics and calculating the area under a curve. At 130 days before the election…
• The chance that a candidate who is 9 percentage points ahead in national polls would end up with a vote margin below 3 points is 15%, conditional on the distribution of polling error since 1980
• The chance that a candidate who is 9 percentage points ahead in national polls would end up with a vote margin below 3 points is 10%, conditional on the distribution of polling error since 2000
• The chance that a candidate who is 9 percentage points ahead in national polls would end up with a vote margin below 3 points is 3%, conditional on the distribution of polling error since 2008
Today, according to the full-range of polling errors in the dataset, we give the polling average a margin of error of 11 percentage points. One other way to look at the current election is: what would the root-mean-squared polling error have to be to give Trump a reasonable (>25%?) chance of winning the election? According to this math, about 9 percentage points—or 1.5x the amount of error in polling averages since 1980 and 3x the expected polling error since 2008.
This all to say that it’s pretty unlikely Trump will win. He would have to pull off an upset an order of magnitude better than his 2016 victory to be re-elected, according to the historical reliability of political polls. I don’t think such a swing is likely (by definition of the margin of error defined above) but I’m willing to hear data-driven arguments about why polls will misfire again this year.


